

The advancements in algorithms and tools for virtual screening have greatly expedited the process of virtual screening. Recent studies have focused on a prospective group of Zika Virus (ZIKV) proteases to circumvent the proliferation of the microcephaly-causing virus. In this research, a structure based virtual screening approach on the ZIKV NS2B-NS3 protease was adopted in order to identify ligands which could potentially inhibit the protease activity. Multiple Receptor Conformation screening workflow was applied through the sampling of initial crystal structure at different random initial velocities by molecular dynamics simulation to account for receptor flexibility. Conformations of the protein were clustered by binding pocket conformations. Molecules from virtual screening libraries such as ChemBridge and Enamine were docked to clustering representative structures using GOLD docking software, and a list of the most common top ranked 100 molecules were shortlisted for molecular simulations. A selected ligand subjected to protein-ligand complex molecular dynamics simulations revealed that the molecule remained stable in NS2B-NS3 binding cleft. Further experimental studies can be performed to validate the inhibitors identified.
Over the years, the computational biology field has been rising in popularity, with increasing relevant applications, one of which is for rational drug design and drug discovery. Current experimental methods of compound library screening in discovery has its own set of limitations. Chemical libraries tend to contain millions of compounds, which requires large amount of time and manpower for shortlisting potential leads. Furthermore, prior to experimental testing, chemical libraries have to be purchased from vendors which can be costly (Kar & Roy, 2013). Virtual screening, on the contrary, greatly reduces this cost, and because of its capability to screen large libraries in a relatively rapid manner, it can effectively and efficiently help narrow down potential candidates for experimental testing.
Virtual screening techniques are broadly categorized into two main categories: the structural based virtual screening and the ligand based virtual screening methods. Structural based virtual screening involves scoring the docked pose of a ligand to the receptor, providing a quantitative measure of ligand binding affinity when structural information about the target is available. Ligand based virtual screening on the other hand, does not involve the 3-Dimensional structure of the receptor. Rather, compounds with experimentally demonstrated activity towards the target binding site are used as template to screen or filter for other compounds with similar activity based on the chemical fingerprints (Koeppen et al., 2011). Given the ZIKV NS2B-NS3 protease crystal structure availability, the structural based drug design approach is used to search for stable binders of the ligand.
Molecular dynamics studies the atomistic motions of macromolecules based on the potential energy function and integrating Newton’s equations of motion, to produce a time dependent trajectory describing the protein dynamic nature and its interaction with ligands. Exploring the energy landscape of the receptor and obtaining sufficient samples of the protein conformations can be computationally expensive. Instead of performing a single long continuous molecular dynamics simulation, multiple short simulations could be performed at differing random initial velocities to take into account the receptor’s flexibility (Awuni & Mu, 2015). Molecular dynamics simulations, which had demonstrated its usefulness in sampling protein conformation and validating virtual screening results, can also be used to study the underlying binding mechanism of receptor-ligand interaction (Durrant & McCammon, 2011).
The Zika Virus (ZIKV) has been labelled as a global public health concern, where a search for potential drug candidate to inhibit Zika Virus became important. First identified in the Zika Forest of Uganda in 1947, the virus is known to be transmitted through the Aedes mosquito species such as A. Aegypti and A. alcobopictus. There are no known treatments that targets the Zika virus specifically, with drugs aimed only to alleviate infection symptoms such as those of the common fever and flu. Infected pregnant mothers can pass the virus to the foetus, causing microcephaly and developmental problems and brain neurological malfunction (Mlakar et al., 2016). Categorized under the Flavivirus genus, the ZIKV Non-Structural 2B - Non-Structural 3 (NS2B-NS3) protease is an essential protein required to cut polypeptides into matured shorter segments, which is a critical stage in the viral developmental cycle. The flavivirus NS2B-NS3 protease cleaves the viral polypeptide into structural and non-structural proteins – trans cleavage of viral capsid, NS2A, NS2A-NS2B, NS3, NS3-NS4A, NS4A and NS4B-NS5 proteins; with NS2B-NS3 through cis cleavage (Bera et al., 2007).
The crystal structure of the ZIKV NS2-NS3 protease obtained by Phoo et al. identified a self-cleaved version of NS2B-NS3, with residues 49-87 from the cofactor NS2B, and residues 19-171 for the protease domain of NS3 (Phoo et al., 2016), in conjunction with the peptide sequence T127-G128-K129-R130 from NS2B C-terminus located in the binding cavity. Phoo et al. also designed an unlinked construct without the TGKR fragment from NS2B C-terminus, bZiPro, which binds with higher affinity to Bovine Pancreatic Trypsin Inhibitor (BPTI). The unlinked protease would then be utilized as the starting structure for inhibitor drug design specific to Zika virus. The unique features of ZIKV NS2B-NS3 protease include the heterodimerization of NS2B and NS3 proteins, polar interactions by K129 of NS2B to S81 and D83 of NS2B, as well as the largely unoccupied S3 pocket located at G128 position of NS2B. Further analysis of the crystal structure revealed the close proximity of the catalytic triad H51, D75 and S135 in the protease domain, that is conserved in chymotrypsin-like serine proteases, adopts the cross-shaped binding cavity (See Figure 1). Recent findings by Zhang et al. identified a molecule EN300 (chemical name: (1H-benzo[d]imidazole-1-yl)methanol) capable of stabilizing bZiPro protease in a thermal shift assay without any perturbations to the protein conformation (Zhang et al., 2016). Stacking interactions by A132 and the aromatic group in Y161 of NS3 on EN300 as well as hydrogen bonding between Y150 and EN300 was found to be responsible for stabilizing the protease. These results spurred the search for potential inhibitors unique to Zika Virus NS2B-NS3 protease by structural based virtual screening methods. The research team hypothesized that EN300 can serve as a docking control to shortlist compounds because of the ability to stabilize crystal structure formation. This project aims to employ structure based virtual screening to screen compound libraries to shortlist potential inhibitors of NS2B-NS3 catalytic activity.
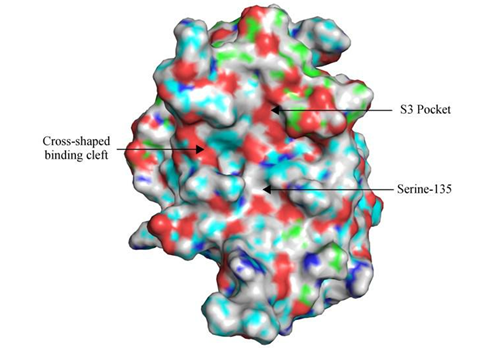
Figure 1: Surface Representation of ZIKV NS2B-NS3 protease after cleavage without the TGKR peptide; the truncated NS2B cofactor in green is observed to be wrapped around NS3 protease domain in cyan. The S3 pocket which lays across the Serine-135 catalytic site is shown to encompass the C-terminus of NS2B in the cross-shaped binding cleft. Oxygen and Hydrogen atoms are depicted in red and white, respectively.
The ZIKV NS2-NS3 protease heterodimer crystal structure obtained from 5GJ4 PDB file was edited to include atoms with Swiss-PdbViewer Version 4.1.0 (Guex et al., 2009). A single monomer crystal structure of NS2B and NS3 was extracted, and the short sequence peptide from the terminus of NS2B, TGKR, was also removed using PyMOL Version 1.8.4.0 . The selected PDB sequence was subsequently used as the initial structure in molecular simulations for conformational sampling.
The crystal structure was firstly enclosed in a unit cubic cell placed in the center of the box, 1 nm from the periphery of the protein, before solvation with Extended Simple Point Charge (SPC/E) water molecules (Bondi, 1964). Atom types and charges for amino acid residues were assigned with AMBER99SB-ILDN (Lindorff-Larsen et al., 2010) force field found in GROMACS 5.0.7 (Abraham et al., 2015). The protein was subjected to energy minimization with a steepest descent algorithm. Minimization was performed to reach a maximum force threshold of 1 kJ/mol. Constant Pressure and Temperature (NPT) equilibration was conducted after Constant Volume and Temperature (NVT) equilibration under position restraints on the heavy atoms. Electrostatic interactions were calculated with the Particle Mesh Ewald algorithm while the Verlet scheme was applied on neighboring groups. Constraints were solved with LINear Constraints Solver (LINCS) on all atomic interactions. With the NPT equilibrated system, five sets of 20 ns molecular simulations were initiated through different random initial velocities. The last frame from the respective sets of molecular simulations was extracted for another 20 ns of molecular simulations in order to further increase sampling of the conformation space.
All 10 sets of 20 ns molecular simulations were corrected for periodic boundary conditions (PBC), unit cell representation to be set as compact, and to be centered on the protein. The molecules were brought back to the unit cell through PBC treatment on the molecule. All ten sets of molecular simulation trajectory were combined into a single 200 ns trajectory at the end with the command trjcat provided in the GROMACS package (Abraham et al., 2015).
In order to identify the representative structures in the 200 ns trajectory, clustering analysis using the gromos algorithm, a utility of GROMACS (Abraham et al., 2015) at 0.16 nm was conducted. Root Mean Square Deviation (RMSD) and least square fitting was performed on the binding pocket specified by residues within 0.40 nm of the TGKR peptide sequence. The identified residues were S81, G82 and D83 from NS2B cofactor domain, H51, D75, D128, Y129, P130, A131, G132, T133, S134, G151, N152, G153, V155 and Y161 from NS3 protease domain. The representative structures from individual clusters obtained at 0.16 nm cutoff were extracted. The representative structures from simulations were then prepared by splitting into separate files for docking to prepared chemical libraries. The preparation for Chembridge Diversity Library and Enamine Discovery Diversity Set was performed using the Accelrys Discovery Studio Client 4.0 (BIOVIA, 2013) to produce 50000 and 10240 chemical compounds respectively.
Utilising Genetic Optimisation for Ligand Docking (GOLD) docking program (Jones et al., 1997), an attempt was made to include water molecules at a spherical radius of 0.60 nm enclosed by the binding pocket as defined earlier in the clustering process. However due to the large number of water molecules located within the specified region, it exceeded the limit posed by the GOLD software on active molecules (Jones et al., 1997). As a result, the ligands were docked to the representative protein structures. A spherical space of radius 1 nm located at the center of the binding pocket was created for docking by the ligands. Independent genetic algorithms runs for each ligand were set at 10, with a search efficiency of 100 %. The scoring function ChemPLP (Korb et al., 2006) was used to score the docking pose of the ligands. Information of the top 100 best ranking ligands were extracted from the best ranking list.
Based on the abovementioned parameters, the prepared screening libraries were docked to the representative structures from the clustering cutoff of 0.16 nm and the Energy Minimized (EM) crystal structure obtained in the initial step of structure preparation. The extracted top 100 best ranking ligands of the Diversity Sets were compared for matching ligands across the middle structure from each cluster and the crystal structure. The docked poses of common ligands were extracted and visual inspection was performed to determine a suitable ligand-receptor complex based on the most number of interactions made with the receptor to be used for subsequent molecular simulation.
An additional docking procedure, where the ligand EN300 concatenated with Enamine Diversity Set library, was set up as a positive control.
EN300 docked pose and the selected ligand-receptor complex from the Enamine Diversity set was delivered to Antechamber (Wang et al., 2006) in AMBER16 package to add Restrained Electrostatic Potential (RESP) charges on the molecule. From the output generated by Antechamber (Wang et al., 2006), R.E.D.-III.4 tool (Dupradeau et al., 2010) in Gaussian09 (Frisch et al., 2009.) was used to produce a gcrt output file and missing parameters of the output file, created by Antechamber utility (Wang et al., 2006). Topologies were built using the general amber force field (GAFF). The rectified topologies and coordinates were saved and converted into GROMACS input file. The aligned ligand coordinates of the docked complex structure to the EM crystal structure was extracted and merged with the EM crystal structure. The protein topology file was corrected to include the ligand topologies and ligand molecule type. The resulting topologies and coordinate files were then used as initial data required for molecular simulation.
The protein complex cubic box, built 1.0 nm around the periphery of the complex, was filled with SPC/E water molecules (Bondi, 1964) using GROMACS (Abraham et al., 2015). Sodium and chlorine ions were added in exchange for the water molecules to neutralize the solution up to the physiological concentration of 0.15 M. The resulting protein-ligand complex solution was brought to a local energy minimum with the steepest descent bringing the maximum force to a value lower than 1 kJ/mol. NVT equilibrium at 300 K was conducted for 1 ns, with constraints solved by LINCS algorithm on all bonds. The Verlet algorithm was applied for neighbor searching cutoff scheme, with Van der Waals forces’ cutoff value set at 1 nm. NPT equilibration was continued from NVT equilibrium, establishing the pressure equilibrium to 1 bar. A 20 ns molecular dynamics production was conducted on the NPT equilibrated system without position restraints. The NVT, NPT and molecular dynamics simulation were executed to produce a time lapse of the system movements under the leap-frog integrator.
The trajectory output was corrected for jumps that occurred during the PBC, with the protein complex centered back in the compact unit cell. PBC correction was performed again on the molecule. Analysis for the resultant PBC corrected ligand-receptor complexes were done using gmx hbond and gmx rms commands from GROMACS package (Abraham et al., 2015). Fitting was performed with reference to the protein backbone. Using the command “make_ndx” in GROMACS (Abraham et al., 2015), index files were generated for the selected groups which bind frequently with the ligand.
Over the course of the 200 ns conformational sampling ensemble of structures, using RMSD cutoff at 0.16 nm generated 3 representative clusters (Clust1, Clust2, Clust3) which were adopted for downstream analysis. The center structures of the cluster group were picked as the representative structure and showed the binding cavity to generally stay as a closed conformation (see Figure 2a and c), whereas NS2B C-terminus was closely attached to NS3 in the substrate binding site. However, one of the clusters (Clust2), depicted an open conformation with the cofactor deviating away from the active region (see Figure 2b). This observation is in agreement with structures studied by other research groups (Erbel et al., 2006; Mahawaththa et al., 2017).
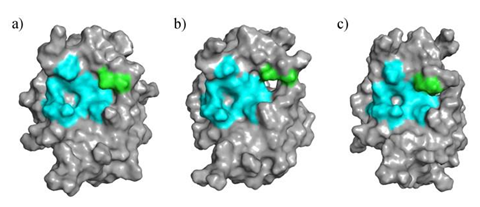
Figure 2: NS2B-NS3 protease representative structures from (a) Clust1 – closed conformation, (b) Clust2 – open conformation, and (c) Clust3 – closed conformation; NS2B cofactor close to the binding pocket are colored in green and residues belonging to NS3 in the binding pocket are colored cyan.
Upon comparison amongst the top 100 ranked ChemBridge Diversity Set ligands docked to all 3 representative structures from cutoff of 0.16 nm and the crystal structure, no matching (common top ranking) result was obtained. As such, the cluster representative which displayed an open conformation representative structure was excluded. The resultant comparison on two closed conformation representative structures and crystal structures produced one matching compound (Molecule A). Due to the lack of matching datasets, four of the abovementioned protein structures were re-docked with prepared Discovery Diversity Sets from Enamine.
imilar to the previous experiment, Clust2 was not taken into consideration, thereby generating five common top 100 ranked ligands across the three structures – Clust1, Clust3 and EM (Molecule B, Molecule C, Molecule D, Molecule E, Molecule F) (see Figure 3). Out of the five selected molecules docked to three structures, it appears that Molecule C forms the most number of polar interactions with the Clust1 representative structure. Formed with residues D129, Y130, G153 and Y161, the number of polar interactions Molecule C makes with the protease were counted to be five. Thus, Molecule C was selected for set up of protein-ligand complex molecular dynamics simulation in order to further understand its binding mode.
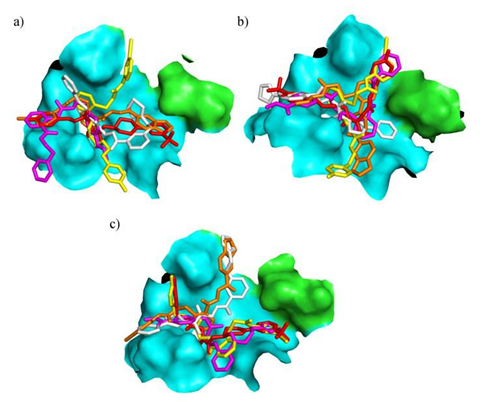
Figure 3: Docked poses of Molecule B (yellow), Molecule C (orange), Molecule D (red), Molecule E (magenta), Molecule F (white) to Clust1 (a), Clust3 (b) representative structure and EM crystal structure (c) where the surface representation was chosen for the binding pocket. NS2B cofactor is depicted in green while NS3 protease domain is shown in cyan.
EN300 was hypothesized to serve as a positive control for docking as it was shown to stabilize the crystal structure (Zhang et al., 2016). The following docking experiment was conducted with a library containing the positive control, EN300 (see Figure 4c), and Enamine Discovery Diversity Library docked to the representative structure of the clusters and the EM protease. Unexpectedly, top 100 ranked ligands amongst all three structures matched six screening compounds which deviated slightly from the previous result (Molecule B, Molecule C, Molecule G, Molecule H, Molecule I, Molecule J) (See Figure 4b and c). It was observed that the hypothesized positive control molecule was scored with a low rank of 10119, 10041 and 10207 out of 10241 compounds in Clust1, Clust3 representative structure and EM crystal structure complexes, respectively. In order to gain a deeper understanding on the structural dynamics of EN300 in the pocket, the team decided to investigate EN300 conformations in a molecular dynamics simulation. This could potentially provide insights into the stabilization mechanism of NS2B-NS3 complex. Clust1 central structure which formed three polar contacts with the positive control, the highest in number compared to the two other structure complexes, along with the docked pose of EN300, was selected as the complex for simulation studies.
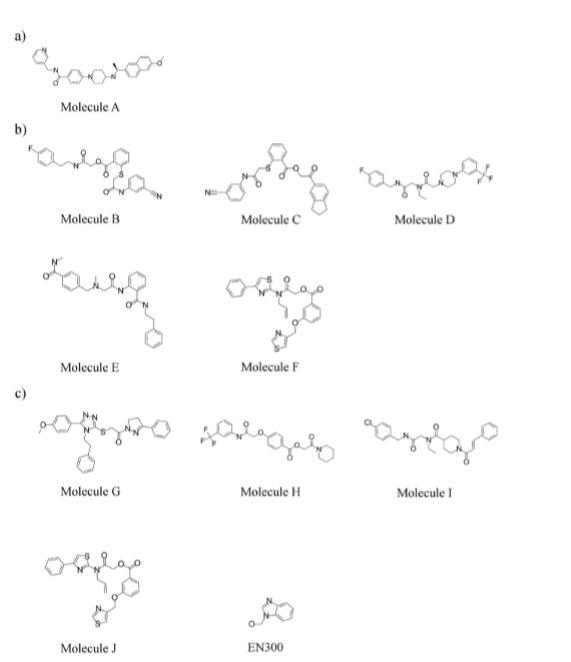
Figure 4: Molecules shortlisted from top 100 best ranking list. (a) Shortlisted molecule for ChemBridge library screening. (b) Common top 100 ranked docked molecules across Clust1, Clust3 and EM structures. (c) Common top 100 ranked docked molecules across Clust1, Clust3 and EM including Molecules B and C from (b). Molecule A was not selected for screening and EN300 was not shortlisted from top 100 best ranking list, but displayed for illustrative reasons.
As shown in Figure 5, RMSD calculation was calculated on Molecule C with fitting to the backbone of NS2B-NS3 molecule. It appears that the RMSD generally stays consistent at 0.2 nm for the first 2.5 ns of the molecular simulation, thereafter fluctuates about a mean of 0.38 nm and stabilizes with an RMSD of 0.65 nm after an additional 14 ns. Comparing the data collected with the PBC-corrected trajectories, a transition in Molecule C from a linear shape to a L-shaped conformation occurs after 2.5 ns of molecular simulation. Due to the rotation about the sulphur atom and central benzene plane, the benzonitrile termini was discovered to move about more randomly in the conformational space. Eventually the flexible chain folds back inwards establishing a U-shape conformation (See Figure 6 and Supplementary Video 1). The residues G151, N152, G153 and Y161 were identified to stabilize the indanyl moiety by polar interactions with the nearest carboxyl and ether group throughout the 20 ns simulation.
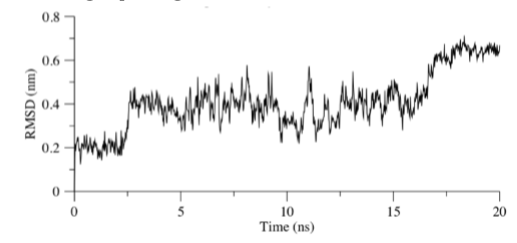
Figure 5: RMSD of Molecule C with least square fitting performed on NS2B-NS3 Backbone for the 20 ns simulation. Groups selected for RMSD calculation were Molecule C and the residues group (G151, N152, G153 and Y161).
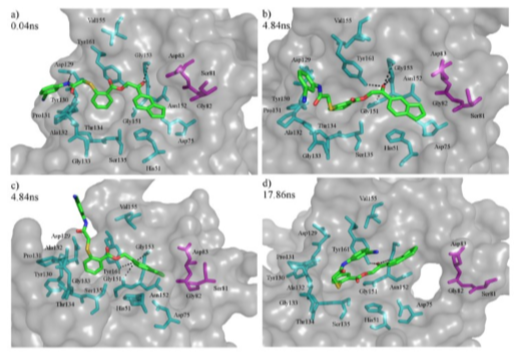
Figure 6: Docked poses of Molecule C in NS2B-NS3 protease. Surface representation of the protease is shown in grey, while polar contacts are shown in black dashes. Cyan, magenta and green stick models represent binding pocket residues in NS3, binding pocket residues in NS2B, and Molecule C respectively. (a) A linear conformation was observed at 0.04 ns. (b) L- shaped conformation adopted by Molecule C shows that the benzonitrile arm appear to move more randomly due to rotation about the central benzene plane and the central sulphur atom (depicted in yellow). The indanyl moiety was found to be stabilized by polar interactions with G151, N152, G153 and Y161. Picture was taken 4.84 ns into the simulation. (c) A side view snapshot at 4.84 ns of Molecule C adopting a L-shaped conformation. (d) At 17.86 ns, Molecule C has folded back onto itself and the conformation was switched to U-shaped, while retaining polar contacts with the receptor.
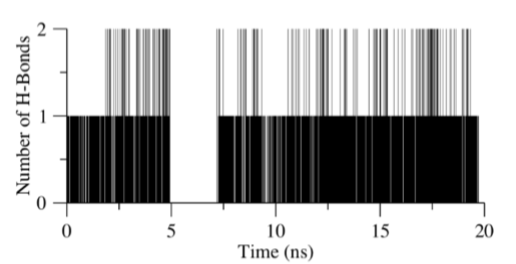
Figure 7: Bar chart of the number of hydrogen bonds occurring in EM-Molecule C complex simulation. Analysis was performed on the residues group (G151, N152, G153 and Y161) with Molecule C. Each frame in the simulation corresponds to a bar, with the bar extending to the number of hydrogen bonds it forms. For the empty spaces, no hydrogen bonds were detected.
Hydrogen bond analysis on Molecule C and the residues group (G151, N152, G153 and Y161) highlight the stability of Molecule C established throughout the 20 ns molecular simulation. Figure 7 describes the number of hydrogen bonds that was formed between the receptor and ligand during the simulation process as a bar chart where the height of each line corresponds to the number of hydrogen bonds while the empty spaces between lines was interpreted as no interaction. The least and most number of hydrogen bonds that occur was found to be 0 and 2 respectively, and the average number of bond occurrence per unit time frame was determined to be 0.978. Moreover, for 81.6 % of the simulation time, Molecule C was bound to the receptor.
Early simulation results for the EN300-NS2B-NS3 protease complex have shown that the ligand was stably bound to the active site. However, it appears that the positive control begins to deviate away from the docking site by approximately 1.0 nm after 10 ns of simulation (see Figure 8). The running average for the first 10 ns was calculated to be approximately 0.2 nm, while that of the next 10 ns was estimated to be 1.0 nm. Hydrogen bond analysis of EN300 to the binding pocket confirms the RMSD results collected. We deduced that it leaves the binding cavity as the RMSD approaches 1.2 nm. The lower limit of interaction count was 0 while the upper limit obtained was 2 (see Figure 9). The percentage of simulation time EN300 interacts with the receptor site was calculated to be 56.2 %. The period of time which hydrogen bonding occurs between the receptor and the ligand appears to coincide with the rise and fall of RMSD values up till 18 ns of the simulation. Regions where the RMSD value peaks such as the timing between 8.5 ns and 9.5 ns corresponded to blank spaces in the hydrogen bonding bar chart. Furthermore, the regions where RMSD stabilizes around 1.0 nm was followed with blank spaces in the bar chart, while regions with RMSD averaged at 0.2 nm matched with multiple bars along the simulation time.
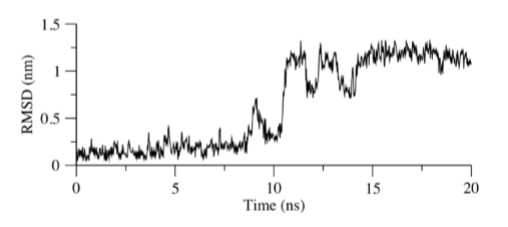
Figure 8: RMSD of Molecule C with least square fitting performed on NS2B-NS3 Backbone for the 20 ns simulation. Groups selected for RMSD calculation were Molecule C and the binding pocket residues (S81, G82, D83, H51, D75, D129, Y130, P131, A132, G133, T134, S135, G151, N152, G153, V155, Y161)
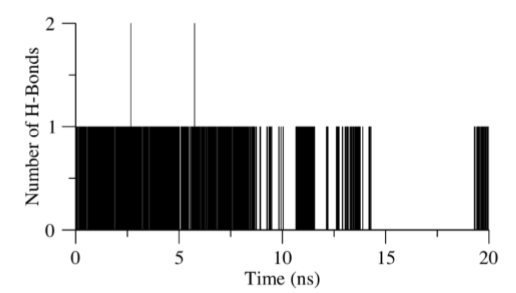
Figure 9: Bar chart of number of hydrogen bonds in EM-EN300 complex simulation. Analysis was performed on binding pocket residues (S81, G82, D83, H51, D75, D129, Y130, P131, A132, G133, T134, S135, G151, N152, G153, V155, Y161) with Molecule C. Each frame in the simulation corresponds to a bar, with the bar extending to the number of hydrogen bonds it forms. For the empty spaces, no hydrogen bonds were detected.
Interestingly, while the RMSD of Molecule C fluctuates based on the conformation adopted, hydrogen bond analysis reveals hotspots in the receptor which maintained the ligand in the active site. A modified version of Molecule C where the benzonitrile section is cleaved, thereby reducing the flexibility of the molecule, could be tested. Furthermore, the selected residues responsible for Molecule C stability matched the residues found in S3 pocket of the binding cavity as described in Phoo et al. literature (Phoo et al., 2016). Simulation trajectories have also shown that the proximity of the indanyl moiety in Molecule C with respect to S3 pocket increases when the protein exhibits an open conformation. This could be explained by the lack of stacking interactions by D83 and the imidazole ring on H51 to keep the indanyl moiety in place. As a result, the specificity as described earlier might be targeted on the open conformation of the enzyme rather than the closed conformation. An extension of the molecular dynamics simulation needs to be performed before a clearer answer can be obtained.
In order to determine if the hydrogen bonding interaction found in the crystal structure between NS2B-NS3 protease and EN300 were comparable to that with the potential candidate, we analysed Molecule C interactions based on hydrogen bonds. Binding results between NS2B-NS3 protease and Molecule C revealed similar hotspots of hydrogen interactions. On the interaction study with EN300, we found reduced formation of hydrogen bonding interactions with the receptor which suggests other dominant interactions keeping EN300 in the active pocket. An in depth analysis needs to be done to study other interactions that holds EN300 in the binding pocket.
EN300 showed poor docking scores. This could be due to the molecular size of the fragment. Being a smaller fragment of low molecular weight, EN300 could potentially interact less than other small molecules in the compound library because of its smaller chemical signature and lower scores through docking (see Figure 4c). Hence, this compound should not be used as a positive control for filtering and shortlisting ligands. It would have been ideal to have a compound with validated inhibitory activity and good binding to act as a positive control for shortlisting compounds, during which only compounds that ranked higher than the positive control would be selected for further analysis.
Nonetheless, the simulation provided the research group with an opportunity to speculate the mechanism in which EN300 stabilized the NS2B-NS3 complex. Results from the simulation showed that EN300 was dynamic in the pocket, leaving the original region after 10 ns (see Figure 8). Additionally, hydrogen bond contacts were also lost (see Figure 9). Hence, no conclusion can be obtained on the stabilizing effect on the protease. There was a lack of stabilizing forces on EN300 explaining for the dynamic movement throughout the simulation. Docking and molecular dynamics results revealed the hydroxyl group in EN300 as the only hydrogen bond donor available. With limited number of hydrogen bond donors available, as soon as the hydrogen bonding is weakened, the mobility of the ligand increases. This concept appears to be consistent with the RMSD and observed hydrogen bonding results. Further work can be done, such as running a longer simulation. Alternatively, methods to study global dynamics can also be employed, where dynamic cross correlation matrix and normal mode analysis can be employed to study the effect of EN300 in stabilizing the NS2B-NS3 complex.
Available crystal structures on Zika Virus NS2B-NS3 proteases in RCSB protein databases mostly show NS2B cofactor as a fragment (Gruba et al., 2016; Lei et al., 2016; Mahawaththa et al., 2017). Being the C-terminus of the chain, the NS2B cofactor exhibits high degrees of freedom which could be observed in the open and closed conformations of the protease as depicted in Figure 2. The flexible nature of the C-terminus in NS2B group causes conformational changes in the binding pocket. The presence of C-terminus in the vicinity of the binding pocket promotes a deeper cavity for the ligand binding. On the contrary, the absence of C-terminus widens the overall binding pocket, reducing the potential surface area for ligand binding. The changes in the cavity as shown in silico might not be an exact representation of the full length protein motion near NS2B V87. This is thus a limitation of this project.
The future work for this project is laid out in three main areas - (1) To analyse pocket volume variations in apo and holo forms of the protein. (2) To evaluate the stability of ligand in the binding pocket through an extension of the molecular simulation between the ligand and the receptor. (3) To determine the dominant interaction between EN300 and NS2B-NS3 Protease and exploring the explore the energetics and weightage of each individual interaction.
In summary, this paper describes the workflow of structural based virtual screening to filter potential inhibitors of Zika virus infections. Multiple receptor conformations, obtained through molecular dynamics simulation, were clustered on the basis of RMSD cutoffs. Top 100 ranking docked ligands to representative structures and EM structures were compared for common matches. Although ranked with low scores, EN300 was picked to study the stabilization mechanism of the NS2B-NS3 complex in preparation of the crystal structure. An extension of the simulation time has to be performed to gain a deeper insight of the dynamic interactions between EN300 and NS2B-NS3 protease. Molecule C was shortlisted from the list and resubmitted for 20 ns molecular simulation. RMSD and hydrogen bonding analysis results clearly showed its potential to remain stable in the binding cleft and to maintain hydrogen bonds consistently with certain hotspots in the cavity. A modified version of Molecule C can be tested for inhibiting activity on NS2B-NS3 protease. Alternatively, targeted libraries could also be used to screen NS2B-NS3 Protease for drug candidates. The findings presented in this paper could pave the way for the development of drugs specific towards NS2B-NS3 protease catalytic activity.
Supplementary Video 1: A 20 ns atomistic simulation of Molecule C bound to NS2B-NS3 Protease at the catalytic site. NS2B-NS3 Protease is represented in grey ribbon, while Molecule C, NS2B and NS3 active site residues are represented in green, cyan and maroon stick models respectively. Molecule C is observed to fold on itself while maintaining polar contacts with the active residues Gly151, Gly153 and Tyr161. At the same time, due to the folding action of Molecule C, NS2B cofactor is observed to move away from catalytic site.
The video is available at the following link: https://www.dropbox.com/s/otpvhh1y364gyv2/Supplementary%20 Video%201.mov?dl=0.
Truncated version of Zika Virus NS2B-NS3 Protease as shown in Figure 1 originated from the PDB file code 5GJ4.
This work was supported by MOE Tier 1 Grant RG 138/15.We thank Liang Zhen, Liu Yang, Lulu, Awuni, Amr, Nafisa and Khi Pin for useful comments.
The authors declare no conflict of interest
K-F.C. designed and performed the computational analyses. K.-F.C and J.T.-Y.N. analyzed the results. K.-F.C and J.T.-Y.N. wrote the manuscript. Y.M. supervised the whole study. All authors have read and approved the final version of the manuscript. The work was performed by K-F.C. for the final year project of a BSc degree.
The PyMOL Molecular Graphics System. 1.8 ed.: Schrödinger, LLC.
Abraham M J, Murtola T, Schulz R, Páll S, Smith J C, Hess B, Lindahl E. GROMACS: High performance molecular simulations through multi-level parallelism from laptops to supercomputers. SoftwareX 2015; 1: 19-25.
Awuni Y, Mu Y. Reduction of false positives in structure-based virtual screening when receptor plasticity is considered. Molecules 2015; 20: 5152-64.
Bera A K, Kuhn R J, Smith J L. Functional characterization of cis and trans activity of the Flavivirus NS2B-NS3 protease. J Biol Chem 2007; 282: 12883-92.
Biovia D S BIOVIA Discovery Studio Client. 4 ed. San Diego:Dassault Systèmes. 2013.
Bondi A. van der Waals volumes and radii. The Journal of physical chemistry 1964; 68: 441-451.
Dupradeau F Y, Pigache A, Zaffran T, Savineau C, Lelong R, Grivel N, Lelong D, Rosanski W, Cieplak P. The R.E.D. tools: advances in RESP and ESP charge derivation and force field library building. Phys Chem Chem Phys 2010; 12: 7821-39.
Durrant J D, Mccammon J A. Molecular dynamics simulations and drug discovery. BMC Biol 2011; 9: 71.
Erbel P, Schiering N, D'arcy A, Renatus M, Kroemer M, Lim S P,Yin Z, Keller T H, Vasudevan S G, Hommel U. Structural basis for the activation of flaviviral NS3 proteases from dengue and West Nile virus. Nat Struct Mol Biol 2006; 13: 372-3.
Frisch M J, Trucks G W, Schlegel H B, Scuseria G E, Robb M A, Cheeseman J R, Scalmani G, Barone V, Mennucci B, Petersson G A Gaussian 09. Wallingford, CT, USA, : Gaussian, Inc. 2009.
Gruba N, Rodriguez Martinez J I, Grzywa R, Wysocka M, Skorenski M, Burmistrz M, Lecka M, Lesner A, Sienczyk M, Pyrc K. Substrate profiling of Zika virus NS2B-NS3 protease. FEBS Lett 2016; 590: 3459-3468.
Guex N, Peitsch M C, Schwede T. Automated comparative protein structure modeling with SWISS-MODEL and Swiss-PdbViewer: a historical perspective. Electrophoresis 2009; 30 Suppl 1: S162-73.
Jones G, Willett P, Glen R C, Leach A R, Taylor R. Development and validation of a genetic algorithm for flexible docking. Journal of molecular biology 1997; 267: 727-748.
Kar S, Roy K. How far can virtual screening take us in drug discovery? Expert opinion on drug discovery 2013; 8: 245-61.
Koeppen H, Kriegl J, Lessel U, Tautermann C S, Wellenzohn B Ligand-Based Virtual Screening. Virtual Screening. Wiley-VCH Verlag GmbH & Co. KGaA. 2011.
Korb O, Stützle T, Exner T E. PLANTS: Application of ant colony optimization to structure-based drug design. International Workshop on Ant Colony Optimization and Swarm Intelligence, 2006. Springer, 247-258.
Lei J, Hansen G, Nitsche C, Klein C D, Zhang L, Hilgenfeld R. Crystal structure of Zika virus NS2B-NS3 protease in complex with a boronate inhibitor. Science 2016; 353: 503-5.
Lindorff-Larsen K, Piana S, Palmo K, Maragakis P, Klepeis J L, Dror R O, Shaw D E. Improved side‐chain torsion potentials for the Amber ff99SB protein force field.Proteins: Structure, Function, and Bioinformatics 2010; 78: 1950-1958.
Mahawaththa M C, Pearce B J G, Szabo M, Graham B, Klein C D, Nitsche C, Otting G. Solution conformations of a linked construct of the Zika virus NS2B-NS3 protease. Antiviral Res 2017; 142: 141-147.
Mlakar J, Korva M, Tul N, Popović M, Poljšak-Prijatelj M, Mraz J, Kolenc M, Resman Rus K, Vesnaver Vipotnik T, Fabjan Vodušek V. Zika virus associated with microcephaly. N Engl J Med 2016; 2016: 951-958.
Phoo W W, Li Y, Zhang Z, Lee M Y, Loh Y R, Tan Y B, Ng E Y, Lescar J, Kang C, Luo D. Structure of the NS2B-NS3 protease from Zika virus after self-cleavage. Nat Commun 2016; 7: 13410.
Wang J, Wang W, Kollman P A, Case D A. Automatic atom type and bond type perception in molecular mechanical calculations. J Mol Graph Model 2006; 25: 247-60.
Zhang Z, Li Y, Loh Y R, Phoo W W, Hung A W, Kang C, Luo D. Crystal structure of unlinked NS2B-NS3 protease from Zika virus. Science 2016; 354: 1597-1600.